
PEST 4.5 was my first PEST participation. I liked the theme a lot. I like using mind maps for writing down ideas for testing. I hoped to get inspiration to continue using visualization in my work. There were five participants there.
There were four topics to choose from:
- How to display current situation – Feature/Area vs. Bugs/Severity
- How to display current situation – Test Coverage
- How to display current situation – New Feature/Area vs. Risks/State of bugs
- How to display current situation – Current State of the Product/Project
For each topic we needed to consider two aspects:
- Current state,
- Iterative
- Trends,
- History,
- etc.
There were four bug categories described:
- Major,
- to be fixed for next release (Next),
- hard to reproduce (HtR),
- Small.
The task was to create a visualization (as easy to grasp as possible) that showed what was OK, what was not OK, which features were new, etc.
We were given an electric bicycle, to choose any part of, as our product. I chose the tracking of cycling. We didn’t need to concentrate on specifics of the example (electric bicycle), we could use abstraction. I created three representations for my topic – Current state of the Product/Project.
First Representation
My first representation was a list really. I tried playing with different colors.
I used:
- gray for project name
- purple for new features,
- black for old features,
- red for major bugs,
- orange for the bugs to be fixed for next release (Next),
- pink for hard to reproduce bugs (HtR),
- brown for small bugs,
- green for when the feature was OK.
For each feature I added information about the number of bugs of certain category (Major, Next, HtR, Small) that were not yet fixed. I also added information about the bugs (what the bug was about). I realized early on that a list would be too much written words at once (so not easy to grasp), but it helped me to figure out which information to display and as it turned out, also which colors to use.
This is how it looked:
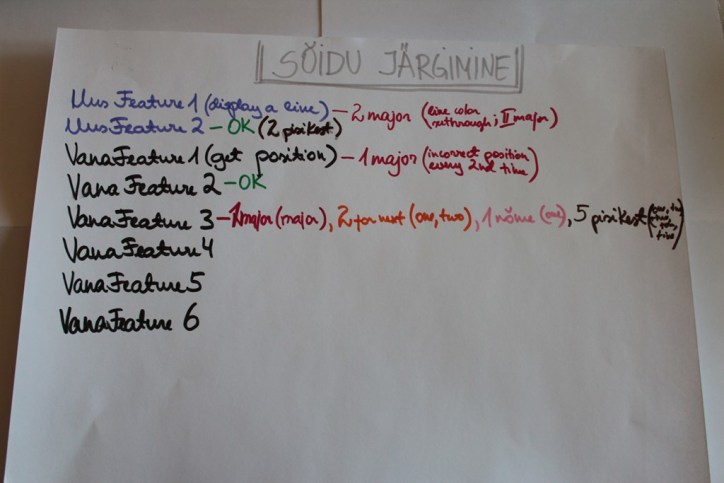
First Representation
Second Representation
I then thought: what about drawing something, e.g. rectangles.
I divided the features between two columns – new features in one and old features in the other. I used the same colors as in the first representation.
Under each feature name I added the number of bugs found during testing. The number of bugs would expand to give a short description of the bug(s).
Each feature had a rectangle around it. The color of the rectangle represented whether the feature was a ‘go’, a ‘no go’ or a ‘so-so’:
- only green – go,
- only red – no go,
- a mixture of green and red – so-so:
- green as the top side of the rectangle – a bit more towards ‘go’
- red as the top side of the rectangle – a bit more towards ‘no go’
This is how it looked:
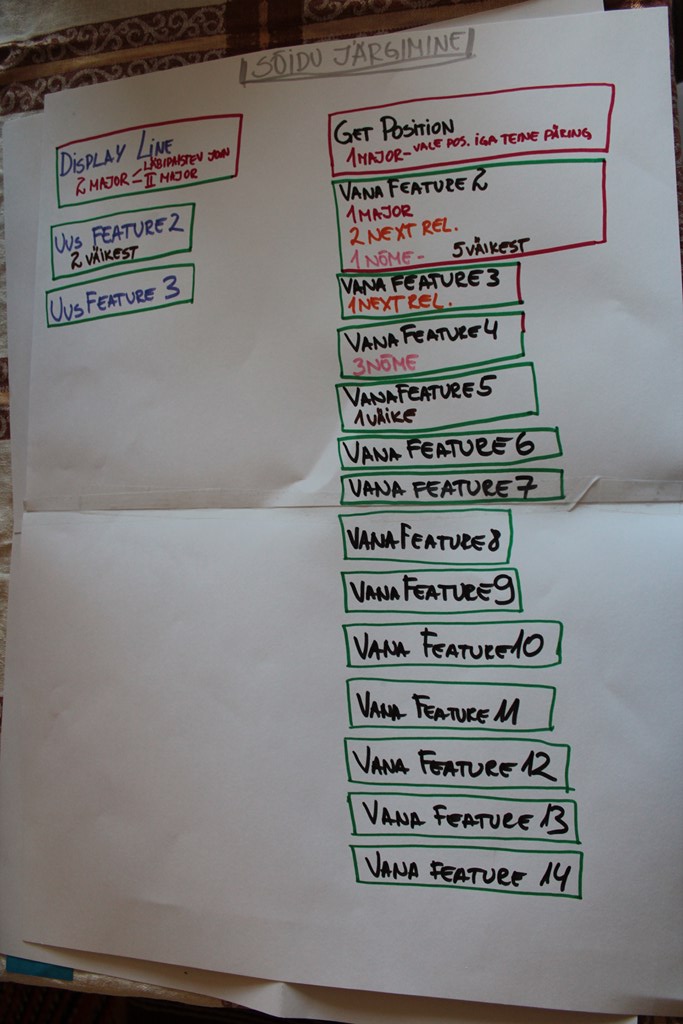
Second Representation
Third Representation
Then I thought I would do another representation and use a mind map for that. I used the same colors as in the first and second representation.
The idea was, that you have the features visible at first (i.e. only the first level bubbles). When you want to see bugs related to the features, you need to open corresponding sub-level bubbles. After looking at the image for a while I decided to add smileys to have a more ‘apparent’ visual sign ( ![]() – go,
– go, ![]() – no go,
– no go, ![]() – so-so). I got the smiley idea when I remembered Sami Söderblom’s track from 2012 Nordic Testing Days.
– so-so). I got the smiley idea when I remembered Sami Söderblom’s track from 2012 Nordic Testing Days.
This is how it looked:
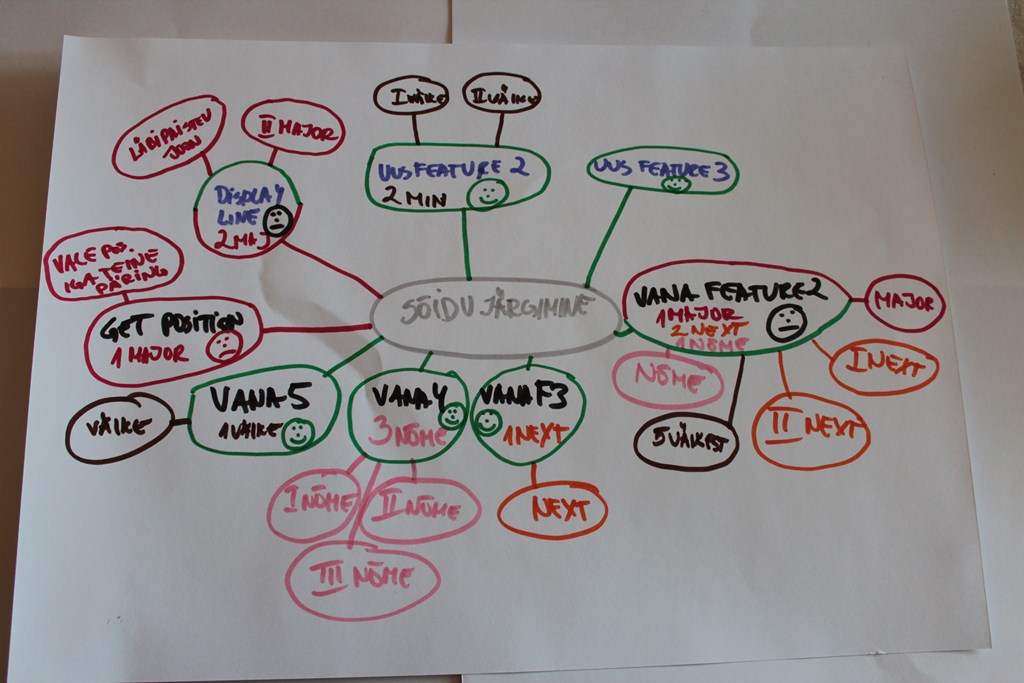
Third Representation
… the questions time arrived. During that Kristjan pointed out that I only have features on one level and suggested that features could be partitioned and their state displayed like this:
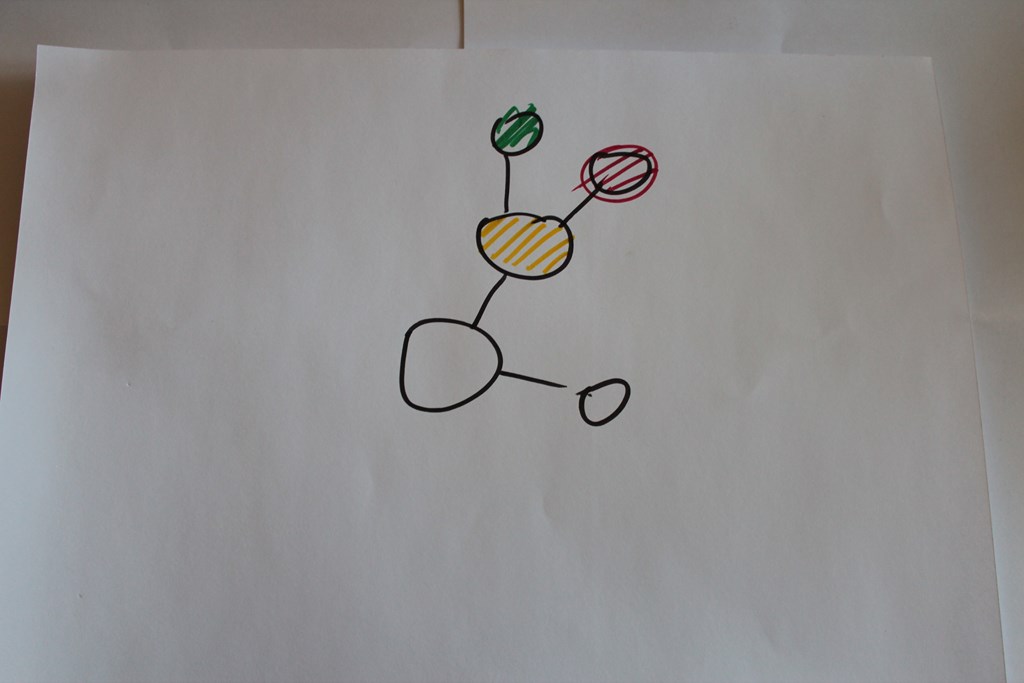
After the presentation
On the image red indicates ‘no go’, green indicates ‘go’ and yellow ‘so-so’.
So, did I get inspired? Yes, I did.
[Go check out the same post and more at Kadri-Annagret’s blog.]

Situs Slot on-line Petrolatum, also called, petroleum jelly is normally employed
in only about almost everything. The dominoqq is a sort of small tiles that is utilised to symbolize the rolling of two dice.
Many different domino sets are used for hundreds of years in different parts of the world to play a wide variety of domino games. http://www.restaurant-onassis.nl/gastenboek